You push 10x more code than in the past. I bet you don’t profile 10x more often.
You push 10x more code than in the past, but I will bet that you don’t profile your code 10x more often. Actually I will bet that you do it less than in the past. And it’s ok! I did the same sin!
But actually, I don’t think that you should profile your code at all. I think that the agent should do that on its own. And it should do it every day, in a loop.
That’s why I created a profiling loop for my project and the results were astonishing. My project CPU consumption dropped by 70% !
And no, I don’t think I’m a shit engineer. I just push new code like a maniac, and I kind of neglected profiling due to a tight schedule and high expectations.
This led me to delegate the profiling task to an agent that constantly finds optimizations like changing libraries, adding caches, and more cool things.
Here I’m going to explain how I built my agentic profiling loop so you can do the same.

The project is owLSM. It’s a Linux runtime security written in C/C++. That’s enough on the project.
If you like this idea, send this to your friend and give us a star on GitHub ⭐
Table of contents
Before we can even talk about AI, skills, agentic loops and other GenZ-Dev words, we have some decisions to make and set up to do.
We are going to break down the flow and talk about every part.
So here is the table of contents:
- Decide what metrics you want to optimize
- Choose the tools for measuring the metrics
- metrics visualization for humans and agents
- Old school stuff
- Skill
- Agentic loop
- Next steps
Decide what metrics you want to optimize
There are many metrics that you can try to optimize.
Some metrics are the same for most projects in the world: CPU consumption, memory consumption…
And some metrics are project specific: time to do X, lock profiling, events-per-second, etc.
In my project I started with: CPU consumption, events-per-second, and dropped events.
In the future I will add: memory profiling (RSS), lock profiling, and cache-miss optimizations.
The optimization goal for my type of project is getting events_per_second up and dropping no events, while reducing CPU consumption. If you only chase CPU, the agent will happily add sleep(1) to your threads and kill your throughput. I know because it did that.
Choose the tools for measuring the metrics
Different metrics require different tools.
Tools can be actual 3rd party tools like perf, scripts you create (like /proc sampling), or even code changes that can track events, time, or anything else.
A few extra recommendations on choosing tools:
- There are a variety of 3rd party tools for a specific job. Choose the most optimized one for your project. For example for heap profiling I chose
HeapTrackoverValgrinddue to the low overhead, which is important in my kind of project. - Code changes that are only for profiling should be behind
#ifdef. You might not want that code in production. So you will need a specific build for profiling. Keep that build as close as possible to your normal release.
Profiling results & metric visualization for humans and agents
You want something that will be easy to read and understand for you and the agent.
My project has 3 output files. Each providing me a different metric and data:
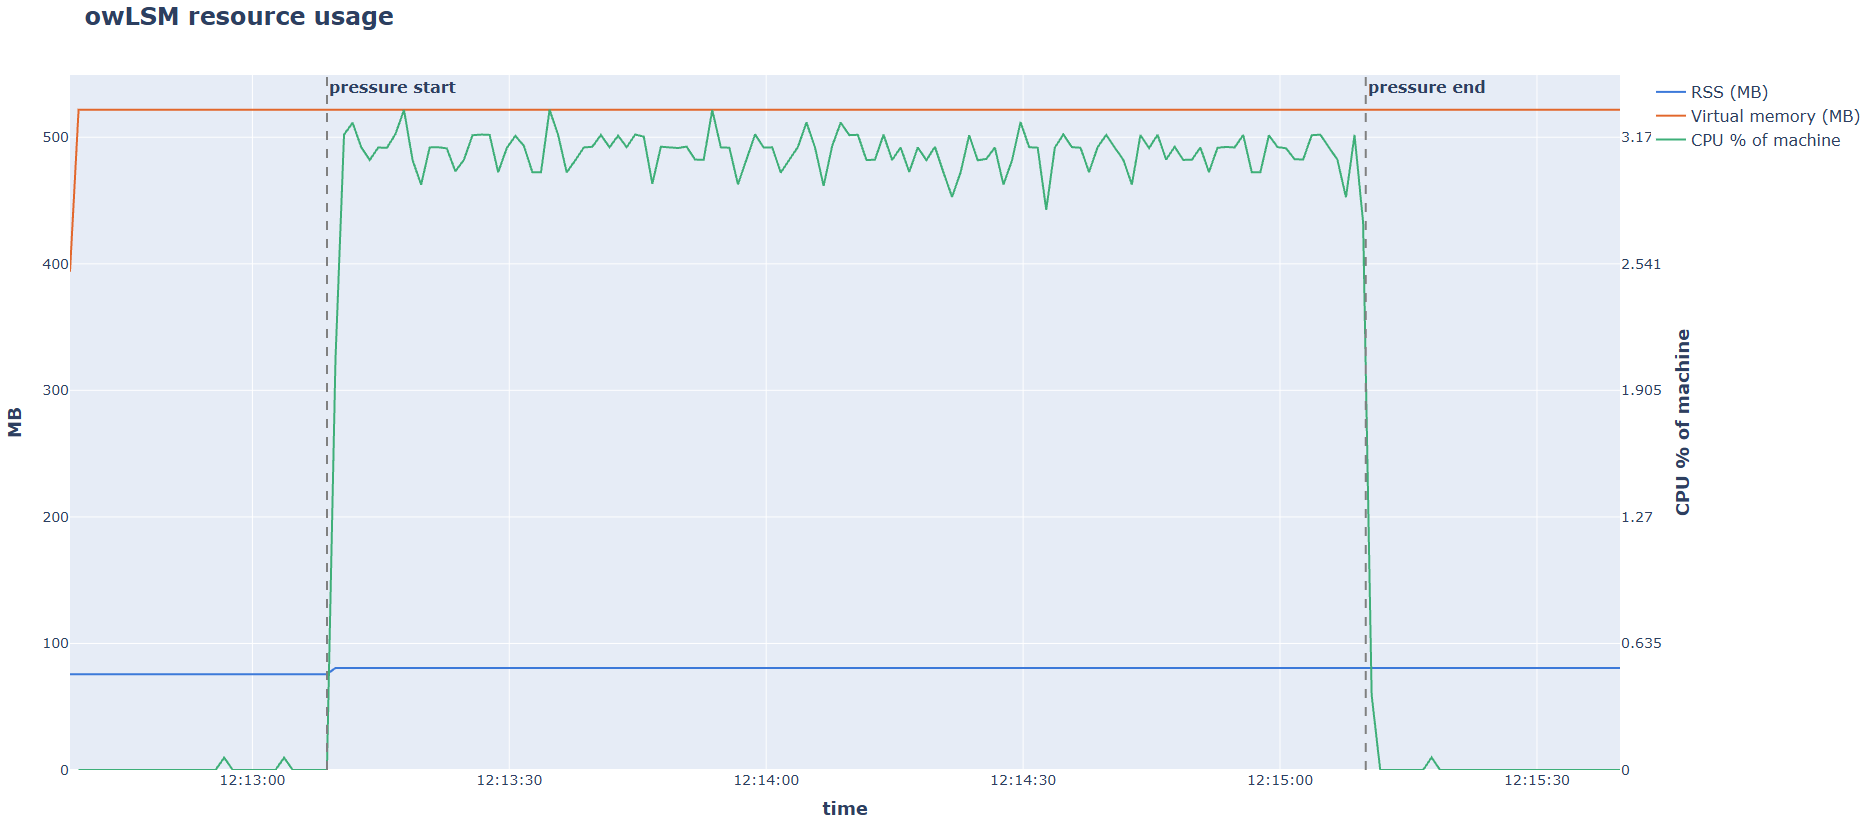
Resource consumption graph: Shows me the overall consumption of CPU%, RSS, and VIRT over time. It also shows me the change between idle state and extreme pressure.
This is a great graph to have as it tells you so much. Only by using this graph I can understand:
- How the project behaves under extreme pressure
- How it compares to customer demands and industry standards
- Whether the pressure phase causes mem leaks, or memory returns to the baseline after pressure
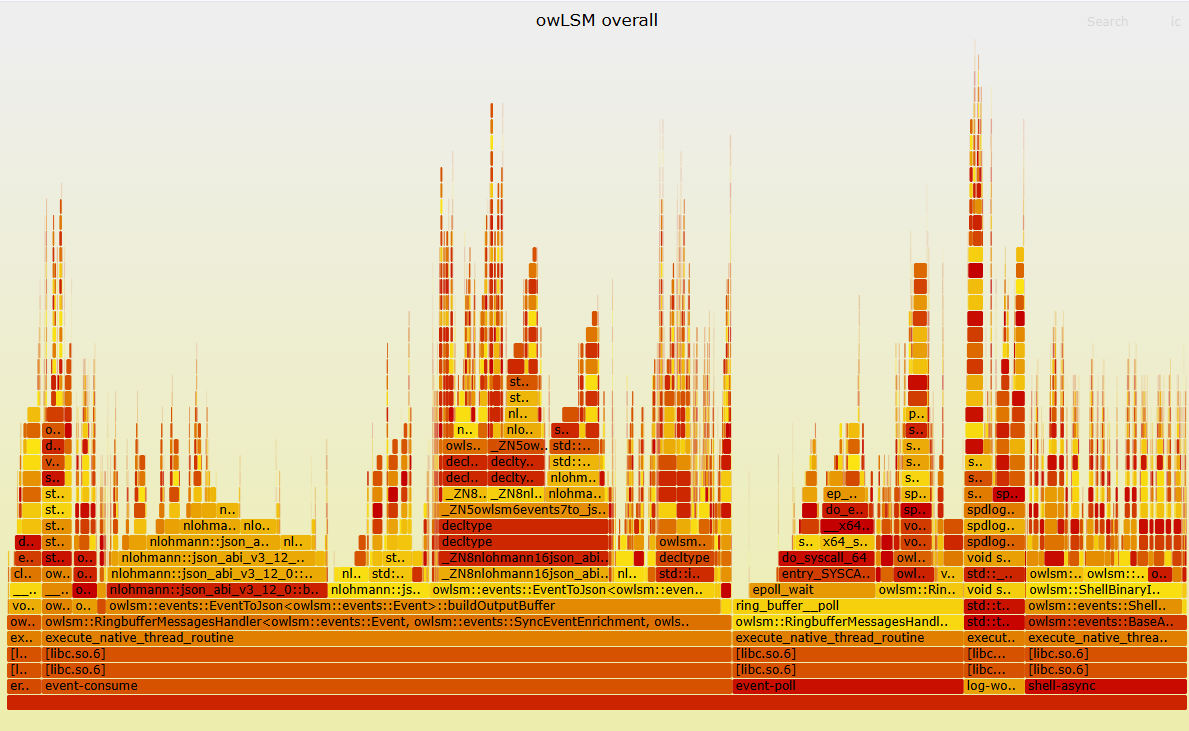
Flame graph: Shows me what stack traces consume what percentage of CPU out of the overall CPU consumption of the project.
Brendan Gregg wrote a great guide on the subject.
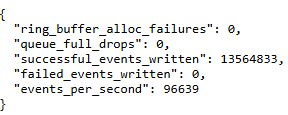
Event statistics. Crucial statistics for a runtime security project like mine are:
- How many events per second it successfully creates
- How many events are dropped per “producer-consumer” situation
- Total events successfully written or dropped under pressure
Environment
Before we can even talk about AI, you need an environment (lab) to run on.
An environment with all the required tools. The required tools and the environment setup are specific to your project. For example, my project is written in C++ and runs only on Linux. So I created a Linux VM with perf (CPU profiler), HeapTrack (heap profiler), flame graph perl scripts (by Brendan Gregg), and more.
Save this environment as a VM template, container, or anything else. So you can reuse it in the future.
End-to-End profiling scenarios
Just like you have “automation tests” or “end-to-end tests” which test your product under different scenarios. You need tests that run your product under specific deterministic scenarios while it’s being profiled by a single tool.
In my project the overall flow is:
- Run the project with config X. The config is what determines the runtime behavior. So different scenarios provide different configs.
- Start profiler Y. The profiler can be any tool that you want. But use one tool at a time, as some tools (like HeapTrack, perf, etc) can add overhead.
- 30 seconds in idle state. Nothing triggers the process to work hard.
- 120 seconds of extreme pressure. This pressure must be deterministic and the same always. You want it to cause the same behavior before and after the optimizations. Like a clean chemistry lab, so the results will be reproducible as much as possible.
- 30 seconds of idle. I want to see how the resource drop looks.
- Stop the process and the profiler
- Generate the result file based on the profiler used
I oversimplified it, but that’s the overall idea.
Now when the agent wants to run a profiling scenario, it just runs a Python pytest program as specified in its SKILL.md.
Skill
Now it’s time to start looking at the AI stuff.
The skill is the instructions the agent reads and follows (SKILL.md), scripts & knowledge base.
Skill flow (oversimplified)
My real flow is a very detailed 16 step process. Here I’m going to create a lame pseudo flow:
- Parse arguments
- Run preflight & rebuild scripts.
- Run profiling tests (each test twice). The results will be our baseline.
- Choose an optimization candidate.
- Implement the optimization
- Rebuild and remeasure (run each test twice again)
- Compare the pre-optimization to post-optimization results. Decide to keep or reject.
- Run all unit tests & automation tests.
- Create a report and save in the Knowledge Base
- Create the pull request
That’s the overall idea. Everything below is how I stopped the agent from doing crazy stupid things inside that flow.
Arguments
The skill should take at least 1 argument.
My skill takes a single argument which is the scenario it should run: /cpp_profiler_optimizations_loop [Scenario]
Skill resources
We want the agent to be as deterministic and token efficient as possible. So for repeated work that is known in advance, we should use scripts and a knowledge base instead of making the agent do the work himself.
What’s left for the agent? Only the artistic parts. Those come later.
Knowledge Base
We don’t want the LLM to try the same optimizations over and over again.
On top of that we want the LLM to learn from prior experiences and optimization attempts.
So we created a dedicated KB inside the skill, influenced a bit by the “ai second brain” architecture.
kb/
├── index.md
├── error-consume-thread-cv-instead-of-sleep-25102026/
│   ├── report.md
│   └── diff.md
├── async-shell-in-memory-cache-of-known-shells-26102026/
│   ├── report.md
│   └── diff.md
Each optimization attempt gets a dedicated subdirectory.
The subdirectory name is {1-10 words describing the attempt}-{DDMMYYYY} and its content is:
report.md: report on the attemptdiff.md: the code changes that were made (like a.difffile) and some details
index.md allows a quick lookup for the agent, so it won’t go through unrelated reports.
Each subdirectory has an entry in index.md describing it in ~3 lines:
# index.md content
- error-consume-thread-cv-instead-of-sleep-25102026: summarizes the report in 3 lines
- async-shell-in-memory-cache-of-known-shells-26102026: summarizes the report in 3 lines
The agent will use the KB when it chooses its optimization candidate and for implementation decisions.
I added the KB to the .gitignore as I don’t want it to be public, but in private repos I think it’s good to share the KB across team members.
report.md must have a defined structure, which is concise but still has all the needed info.
You can see my report structure in the repo, but here are the basics:
**What:** 1–5 sentences on what you tried to optimize.
**Hypothesis:** Why this was a good candidate, and the CPU% you expected to save.
**What were the results:** Numbers vs what you expected. If big difference, why?
With time you will want to change the report structure and add things. That’s totally fine.
Scripts
Here are the deterministic tools I provided the agent with:
clean_and_rebuild_for_profiling.sh: rebuilds the project for profiling, and places everything that is needed in the correct placepreflight.py: takes a lock (a file), checks that another instance of the project isn’t running, ensures the system is readyrevert.py: cleans the system at the end and releases the lockprofiling/: this is outside the skill directory. This has the python program that runs the profiling scenarios, creates the result files, etc.
So I delegated all the known-in-advance work to deterministic scripts.
Decision making - the actual instructions of what and how it should work
This is the artistic part. If you skip this, the agent will still run. It will waste your time and your tokens.
Choosing an optimization candidate
If you just tell your agent “make my code more CPU efficient” you won’t get good results. I saw crazy stupid things, like:
- Optimizations that improved CPU consumption by 0.01% and weren’t worth the code review time
- Retrying the same optimization 4 times
You must specify in the skill the steps of choosing a candidate and the criteria the candidate must align with. Here is a short example:
1. Read the baseline flame graphs.
2. We only want optimizations that cut at least 8% of the CPU consumption. Pick **one** function or a **set of related** functions that take more than 8% of the process CPU consumption and you have a strong hypothesis on how to cut it by at least 8%. If you cannot find such, return "no candidate"
3. Check in the KB if your target or hypothesis were already attempted. If you see something that is similar go back to step `2.`
Full spec is in the SKILL.
How to analyze the results
Analyzing results is not a straightforward job, and there is no chance the agent will do it as you expect it to, without giving it guidance.
I divide “analyzing results” into 3 groups:
- Analyzing a single result file: seeing that the target function CPU consumption is down in the flame graph, but not knowing if the overall CPU consumption is down. As the agent might have just moved the CPU intensive part to a different place.
- Analyzing all the result files together: seeing that an optimization reduced the overall CPU consumption, didn’t affect the event statistics, and the new flame graph validates that the target function consumes less CPU.
- Comparing pre-optimization to post-optimization results: how to compare the results and determine if this attempt should move to the next step or be discarded.
Each group represents a different phase in the agent workflow which we will discuss later.
Let’s do a case study on Analyzing a single result file with the target result file being the Resource Graph, which is complex and has a lot of data.
Before I explicitly told the agent how to analyze the Resource Graph, he gave the idle time CPU consumption more importance than the “under pressure time”. Which for my project is wrong.
But how would you want the agent to interpret it? What should it prioritize, CPU spikes, or average CPU under pressure? Should it care about the idle phase, or only the pressure phase?
There are many questions like these to answer. There is no single correct answer, but you need to determine these things in advance.
You need to specify what the result file contains, and how to read it.
Here is a shorter example of why I wrote in the SKILL:
**Resource graph (`resources_graph.html`)** — CPU, RSS, and virtual memory over time, sampled once a second from `/proc`. CPU is percentage of the whole machine (all cores). The graph marks when pressure started and ended. The CPU number to compare is the **average** CPU % of the machine **under pressure**. Do not use the idle windows. Use this graph to see whether owLSM actually used less CPU / RSS / virtual memory.
What is a successful optimization
If you don’t provide good rules, you will find yourself constantly rejecting pull requests. Before locking in on my rules I would get slop “optimizations” like:
- increasing sleep time to get more off-CPU time, which indeed caused CPU to drop but caused events-per-second to drop by 75% as well
- changes that completely broke the expected behavior, and caused tests to fail
A successful optimization is defined by 2 checks:
- Comparing pre-optimization to post-optimization results: post-optimization shows improvement across all the results files
- Running test suites and analyzing failed tests: tests didn’t fail. And if they did, what is accepted.
Comparing pre-optimization to post-optimization results
I called this guide Keep or reject. This is a very long section, so I’m going to recap it.
It starts with a prologue explaining this step’s mission to the agent:
Look at all three signals together: did mean pressure CPU/RSS/virt go down, did event statistics stay healthy, and did the function you targeted take less CPU
Then a whitelist:
Keep only if **all** of these are true:
- **Both** post-optimization runs show similar **CPU improvement**...
- That CPU improvement meets the bar in **Choosing an optimization candidate**...
...
Then a blacklist:
Reject if **any** of these are true:
- Average CPU % of the machine under pressure goes up in any post-run.
- events-per-second goes down by more than 2% ...
...
Reasoning behind some rules:
- The 2% margin is there because the number of syscalls on the machine is not fully under the test's control. Even two runs of the same binary differ.
...
Running test suites and analyzing failed tests
Hopefully the optimization didn’t break anything and didn’t change the “exported/public” behavior.
If your project has both unit tests and automation test suites, you can rely on them to raise a flag if something is broken.
As part of the optimization loop, the agent will run the tests and verify nothing is broken. But if a test failed, what should the agent do?
Should the agent modify the test? Agents have a tendency to drop the correct checks in the test and thus “bypass” the bugs.
Should a failed unit test cause the agent to drop a great optimization commit?
Make those decisions yourself, but here are some of my decisions:
# When unit tests fail
Investigate the failure before you decide anything. Do not "fix" a failed test by weakening it unless the case below says you may.
Ask: did this optimization change only an **internal detail** that does not change that "exported/public" behavior?

- **Only an internal detail changed**, and you **agree** with that internal change. Update the unit test to match the new internal detail, then continue to automation.
- **Only an internal detail changed**, but you **do not agree** with that change. Reject it.
...

# When automation tests fail
Never edit the automation tests. If automation fails because of your change, reject.
Pull request
- Should the agent create a pull request when the optimization was accepted by What is a successful optimization ?
- Branch rules: naming, source, etc.
- What will the agent use? A CLI tool, GitHub MCP, script, etc.
All these decisions can only be made by you.
My only suggestion is that the pull request body should be the report.md of that optimization attempt. See example for a pull request
Agentic loop
After you ran your skill several times and you are happy with the results, it’s time to start an agentic loop.
An agentic loop is just a “scheduled task” that runs your prompt every X time. So our prompt is just the skill name with an argument.
Every modern coding agents supports loops, by using the /loop option. So in your coding agent do:
/loop 12h [skill_name] [argument]
To run the loop every 12 hours.
Here is my command for my project:
/loop 24h cpp_profiler_optimizations_loop CPU_JSON
This runs the optimization loop every 24 hours.
Next steps
After you spent an hour reading this article, here is what you should do next:
- Check the full SKILL.md
- Start building one for yourself. Base yours on mine.
- Give us a star on GitHub ⭐, it will mean a lot https://github.com/Cybereason-Public/owLSM